Double digits spell danger, but what happens next?
The Nationwide House Price index finally broke into double digit inflation at the end of May with annual average house price inflation reaching 10.9%, its highest level in almost seven years, and the June numbers show another leap forward to over 13%. Make no mistake, inflation beyond 10% is simply unsustainable, even in the mid-term. The paragraph below was taken from a half-year update I wrote seven years ago in June 2014
Crucially, in the 31 years that the Halifax Index has been in existence, double-digit inflation has only ever lasted longer than 12 months on two occasions, once from 1986 to 1989 and latterly from 2002 to 2004. In fact, no single year in all the other 24 has shown double-digit inflation.
It is worth noting the 86-89 boom was followed by a genuine ‘crash’; properties were repossessed, businesses went bust and recession followed. Although the market didn’t completely collapse after the 02-04 upsurge, the downturn in 2005 was rapid and more than a little challenging.
Today’s double-digit inflation will not last for 12 months. I am confident it won’t last six months.
As the cool breeze of rising inflation threatens interest rate rises and the icy blast of the end of the Stamp Duty holiday chills the over-heated market, the tricky question is how the market will make its transition from frenzied to considered, or even conservative. To determine the rate and extent of the inevitable weakening in both value and volume, we need to take a proper look at what has caused the current, largely unexpected, surge.
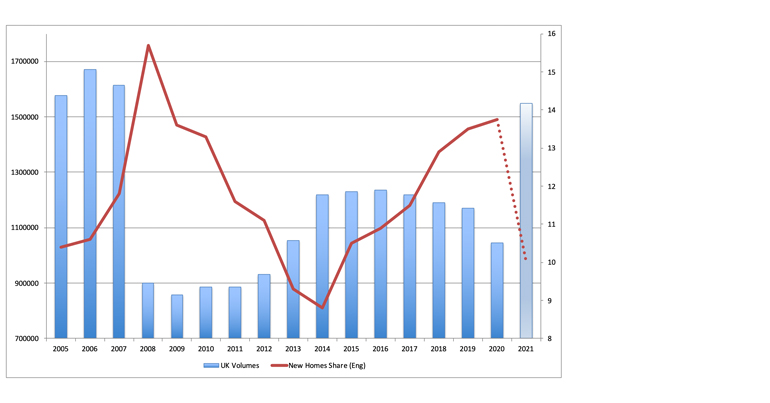
The dramatic uplift was built on four distinct pillars that provided a perfect base for a market that has been subdued since the 2008/9 recession when transactions fell from over 1.6M a year to a steady 1.1M – 1.2M, a volume that had been remarkably consistent over the six years up until 2020.
These pillars are, in no particular order; Stamp Duty, interest rates and mortgage availability, changes in homebuyer lifestyles and UK consumer sentiment. While each of these pillars has a discernible effect on the market, their intensity and rapidity of outcome varies enormously. Let’s consider them one by one and what their effects are likely to be on the market over the next 12 months.
1. Stamp Duty (SDLT)
This is the most obvious and most significant of market influencers currently in play. Don’t ever underestimate the effect of stamp duty variation on the buying public. People hate this tax. In 35 years of creating advertising messages for developers, in all sorts of markets, the “We’ll pay your stamp duty” proposition has always performed well. In one case, back in the dark days of 2009, we changed an ad offering a discount of £10,000 to a ‘Stamp Duty Paid’ offer (worth just over £8,500), it outperformed the straight money off deal by almost 50%.
Consider this; in the rush to save up to a maximum of £15,000 in SDLT by meeting the end of June deadline, countless buyers have been prepared to pay, on average, almost £25,000 more for their new home!
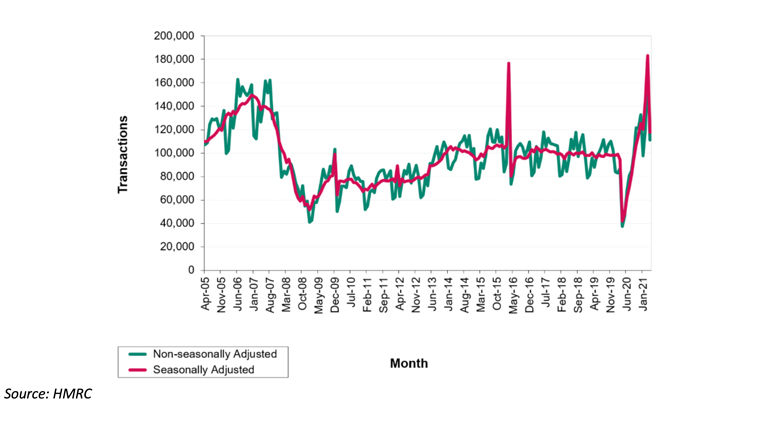
And, if you still have any lingering doubts about the effect that SDLT rates have on the market, look at the chart below, produced by the HMRC and showing transactions with a value over £40k. You might just notice two enormous spikes, the first in March 2016, just before the introduction of higher SDLT rates in April 2016 and the second as we approach the end of current SDLT holiday. The sharp-eyed amongst you might notice another, much smaller, spike in December 2009. Yes, you’ve guessed it, it was the end of an SDLT holiday.
Looking at the HMRC data over the last 16 years, it’s evident that the varying of SDLT rates has a substantial and immediate impact on the housing market. I read somewhere that the Government estimated that the SDLT holiday, introduced to counter the effects of the lockdown, would probably increase average values by around 2%. With hindsight, I think that was probably an underestimate, but at the time I would probably have agreed with them.
As part of our consideration of the four pillars of the current market conditions, we need to rate each in terms of speed and severity of impact on the market to help us predict what the next 6 to 12 months will bring. For SDLT, I rate the impact as high and speed of effect as immediate. As the SDLT holiday unwinds, I believe it will cause a fall in the rate of increase in prices equivalent to around 4% in H2.
2. Interest Rates and Mortgage Availability
One of the things that Gordon Brown will be most positively remembered for during his stint as Chancellor will undoubtedly be his decision to move the control of interest rates from Government to the Bank of England in 1997/8. Making fiscally based judgements, rather than political ones, brought a new-found stability and avoided ‘knee-jerk’ reactions delivering short-term shocks to the property market.
In these days of ultra-low interest rates, any adjustment is spoken of in terms of ‘Basis Points’, 1/100th of 1 percent. So, 25 basis points is just a quarter of one percent. Rates are ‘nudged’ rather than adjusted and while they do still affect buyer sentiment, the popularity of fixed-rate deals and the current historically low levels of interest, make them a less powerful influence on the market. Much more significant is the availability of mortgages. If homebuyers can’t borrow, they aren’t able to buy, and that has an exceptionally powerful effect on the market.
News stories of rising inflation give cause for concern, but this is inflation from a low, covid-affected base and I believe it needs to be rising much more aggressively before the Bank and the Government consider it necessary to take market changing action. Particularly considering the need for economic recovery from the pandemic.
I’m no economist, but as far as the effects of our four pillars are concerned, while interest rates and mortgage availability have a fast, high impact effect on the market, I believe it is most unlikely we’ll see any major changes during the next 6 months. On balance, I am going to rate the impact of pillar number two as neutral in H2.
3. Lifestyle Changes
One of the most dramatic effects of Lockdown has been the ‘Working from Home’ (WFH) revolution. Will we ever go back to spending hours of our lives commuting into towns and cities to spend our days working alongside colleagues in over-crowded offices and travelling countless miles to meetings on clogged roads and motorways? I doubt it, not in the volumes we used to, in any case.
Homebuyers doubt it too. There has been a big change in the key factors influencing buying decisions. People are re-evaluating their life choices; do they really want to live how and where they are now, given that getting into an office every morning isn’t necessarily a consideration? There has been a significant increase in the number of people looking to move out of town and city centres. They are also worrying less about their proximity to a mainline station or a motorway junction. Gardens are suddenly a must have and space is also at a premium – and more than ever before, so is a fast internet connection and high-tech, sustainable living. (Developers take note.)
Properties that tick all these boxes are sold within hours of coming onto the market and are playing a significant part in driving average prices up.
The shift in popularity from flats to houses had already taken hold before the pandemic broke, for a completely different set of reasons, but Covid has dramatically accelerated the desire for a change in lifestyle, making the trend much more noticeable than before. This pressure cooker effect gives the impression that everyone is packing up and heading for the country, demanding huge gardens and home offices, but lifestyle changes, by their sheer nature have a gentler effect on the market. Don’t get me wrong, the smarter developers spot this sort of trend early and take advantage of it, but when it comes to the effect it is going to have on prices in the mid-term, it will be much less influential than our first two pillars and less immediate too.
This pillar will have a gentle effect and will continue upwards for the foreseeable future. In my calculations I estimate it will add around 1% to average prices in H2.
4. Consumer Sentiment
Consumer sentiment is such an important constituent part of the property market and is probably the very best guide to short and mid-term market movements. I often hear the argument that it is the property market affecting sentiment, rather than the other way around, but I’m a great believer in the ‘three-month wave’ effect. These are short-term trends in changing sentiment that are invariably replicated in the market in the following three months.
Even way back in August 2008, the three-month picture was a clear warning of difficult times ahead, with consumers’ confidence in the economy sliding from -43 in June to a new super-low of -63 in August – and that was before the queues started forming outside Northern Rock in early September and Lehman Brothers hit the buffers shortly after.
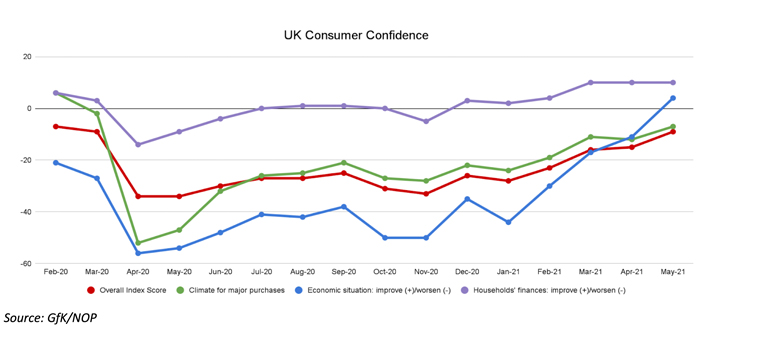
I’ve followed the GfK/NOP Consumer Confidence survey for more years than I care to remember, and it has always delivered. It’s simple, reliable and consistent and is always the first data source I refer to when considering where the market is headed next.
What is remarkable about the chart for May that I’ve shown above, is the public confidence in the UK economy (the blue line). Other than a small dip in January, it’s been climbing since last November and has finally broken through into positive territory for the first time since August 2015 – almost six years. The overall index score (red line) has also been climbing through that time, under-pinning the rise in house prices, and suggesting to me that, SDLT holiday aside, the underlying position is positive in the short to medium term.
The effect of this pillar on the market, much like changes in homebuyer lifestyle choices, tends to be more gradual and easier to identify. In my view, as the percentage of double-jabbed adults in the UK continues to grow and the link between infections and deaths is broken, the overall effect in the mid-term will be positive, probably adding around 1.5% to average prices in H2.
It is very easy to over-simplify such a complex and labyrinthine beast as the UK residential property market, with all its twists and turns and regional variations, but there is little doubt that these four pillars are the most significant factors, certainly in the mid-term. So, how will prices move in the second half of 2021?
The Stamp Duty effect will undoubtedly move the needle, not just from June into July, but also on the expiry date of the second taper, at the end of September. But the underlying conditions will cushion the blow. It is extraordinary that BREXIT has not been mentioned at all throughout this market update, but such is the all-consuming nature of the Covid pandemic and its collateral effects, it has almost been forgotten. However, we haven’t seen the last of the fallout from our EU exit. Focus on the economy will return once Covid is under control.
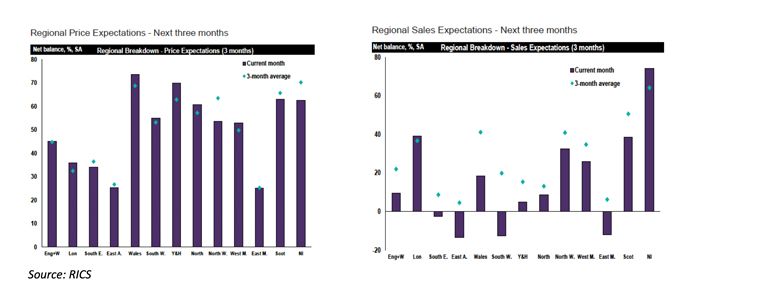
The other data source I always reference when considering short-term market movements is the RICS survey. It needs to be handled with care, given its low sample numbers and subjective respondents, but it is a great barometer of how the UK’s agents and valuers are seeing things and invariably paints an accurate picture of the mood in the industry overall.
The May Survey reveals an interesting dynamic. The charts below show regional price expectations, the left-hand chart, compared to regional sales expectations, the right-hand chart. The issue is obvious. Lack of availability is driving prices but restricting volumes.
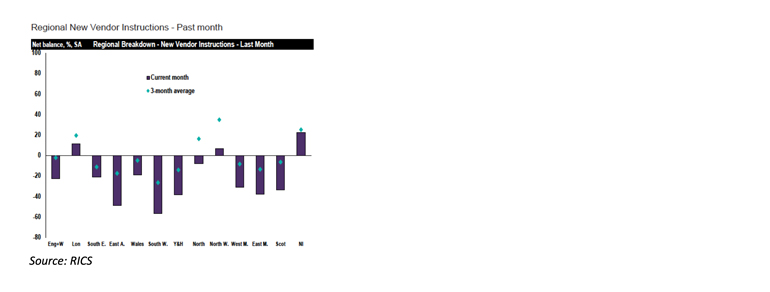
The eventual result of this type of market sees people withdraw from the market, waiting for the situation to improve, and that is borne out by the third chart below, showing new vendor instructions falling in almost every region in the UK.
This stepping out of the market tends to have a cooling effect as activity drops and it fits with my view of how things will outturn over the second half of the year.
I believe we’ll see a drop in the rate of increase in average house prices in Q3, probably by as much 3% or 4%, I forecast the Nationwide numbers will be showing an average annual rate of increase of around 7% at the end of the quarter. However, the effect of positive consumer sentiment and changes in lifestyle will buoy the market and I believe it will have an unexpected resilience in Q4. I forecast we’ll end the year with average house prices at 6.5% – 7.5% above their 2020 position.
In consideration of the key factors affecting the market, where does that leave us in terms of volume? One thing’s for sure, at the start of this year, no-one (including me) predicted the dramatic increase in transactions in 2021 after six years of static volumes up until 2019 and the fall following the strangulation of the market during the first lockdown in March 2020.
We don’t have the HMRC numbers for May yet (they are expected to be released within the next day or two), but they will be very high indeed, as will June, as buyers race to beat the Stamp Duty deadline. There will doubtless be a severe reduction in July and August, but we will still end the year with highest number of transactions since 2007, probably at around 1.55M.
Generally, as overall transactions climb, the new homes share of the market falls. The number of speculatively built new homes can’t flex as quickly as the market moves and that is the inevitable result. Add to that the extreme problems the developers are facing in terms of materials and labour supply, then it seems likely that their market share will fall back to just below their long-run average of around 10%.
The developers face other issues too. Labour is in short supply as are materials, with costs rising steeply, probably more than fifteen percent before the year is out for key staples like bricks and blocks, and timber much more than that. When margins are squeezed, with costs rising faster than house price inflation, it makes it more difficult still to maintain market share. However, while the new-build percentage share of the market is falling, it is against the backdrop of much higher overall volumes and I’m of the opinion that raw volumes for spec. build homes will continue to climb in the next two years, particularly if we see the implementation of the planning system reforms that are being currently considered by the Government.
I believe we’ll have a bumpy ride through the second half of the year for all the reasons I’ve set out, but it’ll end in strong positive price growth. I’m not so sure about H1 of 2022. I’ll be watching how that consumer sentiment moves very closely indeed.


